Soccer championship Euro 2016 - A weekend project, from July 2016
Continued from a previous blog post, that explained the data preprocessing steps.
I wrote this in July 2016 to make myself familiar with the R package
ggplot2, and other tidyverse packages. This post contains exploratory analysis of an Euro 2016 Betting Game. Predictions were made, just for fun and a small amount of prize money, by a group of players at my workplace. Participants in the betting game were about 300 colleagues, their friends and family members.
Some definition of terms: In this context,
- Player means ‘Participant in the Betting Game’, not ‘Professional Soccer Player’ in one of the matches played during Euro 2016.
- Bet means ‘Score’ (in goals, e.g. “Germany-France, 0:2”). The predicted result of a match at Euro 2016.
- Prediction means ‘more or less educated guess’ made by some colleague of mine, or one of his/her friends, or family member. It does not mean ‘prediction’ in a machine-learning sense (e.g, as a result of fitting a model)
In 2016 I submitted the original version of this post to RPubs.com, the default website to upload to from within the Rstudio IDE, but the RPubs website has evolved to a dump of countless low-quality submissions of student homework, and I want my content at a central place. Therefore, I’ve reposted it here.
About the dataset
There were ~300 players predicting scores of the ~50 games during the Euro2016. This means there are 300 * 50 = 15000 predicions to analyze, but in fact there are only around 13000. This is because many players dropped out of the game, or lost interest during the Euro 2016, which lasted for 30 days. Nearly all players made full predctions for the group stage, but during the Knock-Out Stage of the Euro 2016, there were only brief periods of about 2 to 4 days, when players had to make their bets. Apparently, many people simply missed their deadlines.
The rules of the betting game are too complicated to explain here. Probably the most important rule is that each successful prediction gets some reward points. Predicting the exact end result gets more points that getting just the tendency (win/draw/loss) right. All players had a set of 10 ‘Joker’ games available, which double the reward points earned. Players were free to assign this ‘doubling’ reward to any upcoming soccer game. Of course people used their favorite teams, and/or those games they were most certain about with respect to the end result.
Data preparation -See part 1
The dataset of the player’s bets/predictions is not public, because there are full names of real people inside. Maybe I’ll show anonymized results of a small part of it at the end of this post. In 2016, I’ve used a little script to screen-scrape the data from the (internal) website, and then I copied it all together into a big csv-file. See part 1 of this blog post for details. Here I read in everything from an .RData-File, R’s proprietary storage format. This populates our workspace with a lot of precalculated objects. The most important is the euro16_bets_per_game data frame.
Data analysis
Load precalculated objects into global environment:
datadir <- "data_private/gfzock/"
#assertthat::see_if(assertthat::is.readable(datadir))
infile <- here::here(datadir, "gfzock_euro2016_preprocessed.RData")
#assertthat::see_if(assertthat::is.readable(infile))
load(infile)
R packages needed
library(tidyr)
library(dplyr)
library(lubridate)
library(purrr)  # functional programming
library(stringr)
library(readr)
library(ggplot2)
library(ggrepel) # better labelling of datapoints
library(knitr)
library(assertthat)
theme_set(theme_bw())
There are 286 players predicting scores for 51 games.
How many players actually participated over the course of the tournament?
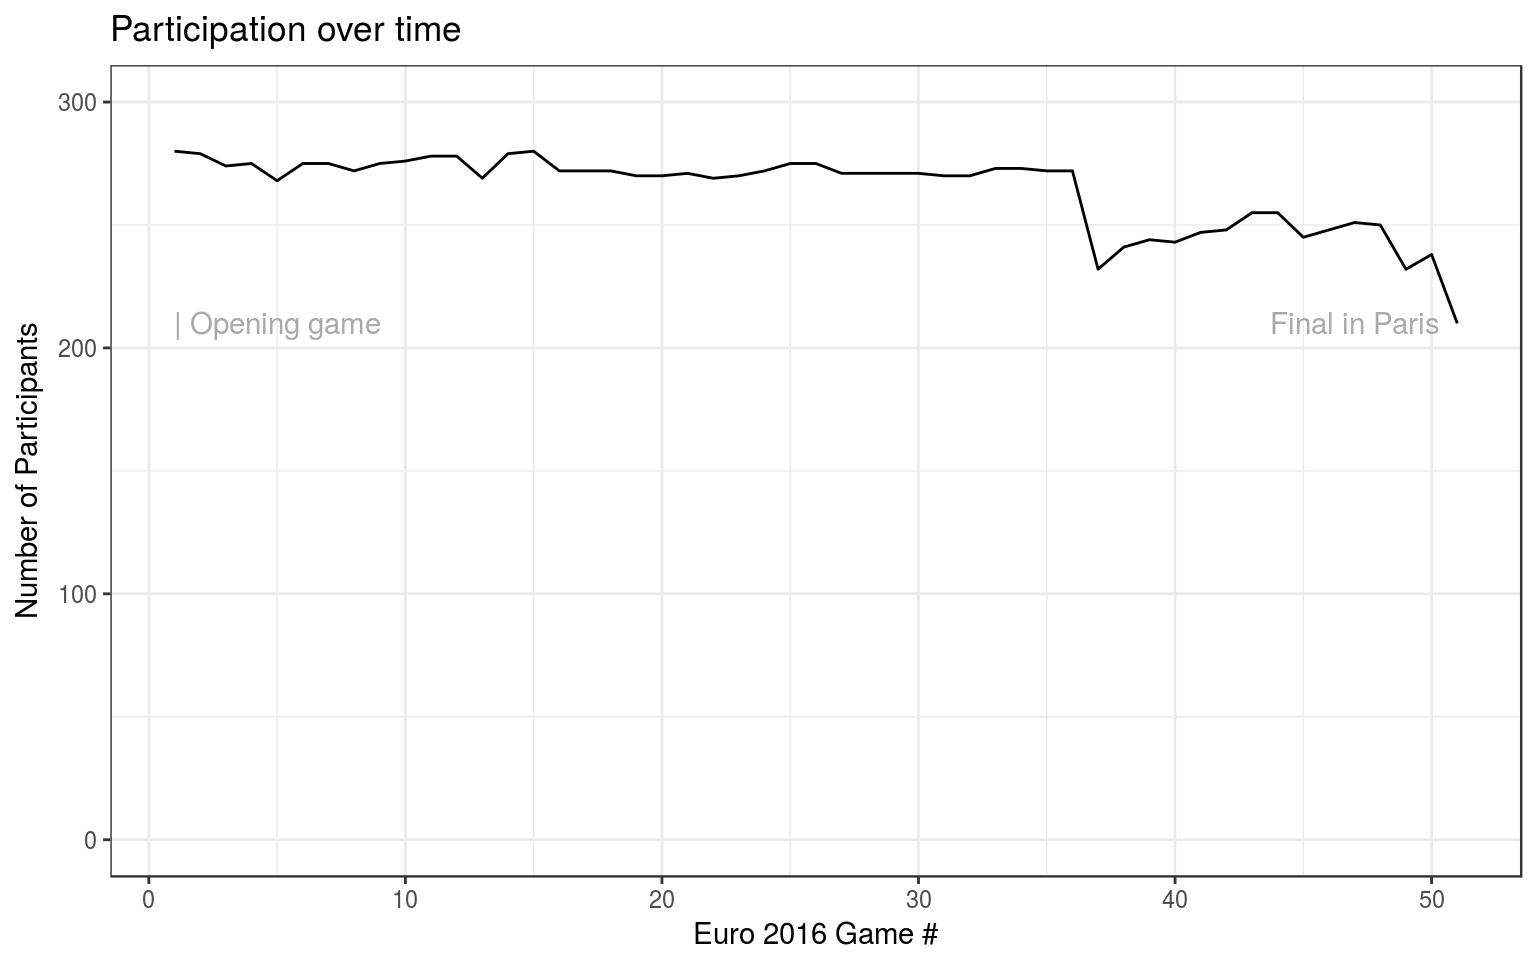
Some players registered with the website, but failed to pay the registration fee in time, thus they were never able to to predict anything.
There was a bump in participation during the transition from group stage to KO-stage, because, again, many players missed to register their bets before the many KO-stage submission deadlines. Here the deadlines were much stricter than at the beginning of the tournament.
The plot also shows that many people did not bother to place a bet for the last game, the Final in Paris.
More detailed analysis of bets made
Create joint table of players and their bets.
## Observations: 13,474
## Variables: 11
## $ player_last_name  <chr> ...
## $ player_first_name <chr> ...
## $ team_a_goals      <int> ...
## $ team_b_goals      <int> ...
## $ is_joker          <lgl> ...
## $ game_nr           <int> ...
## $ tendency          <chr> ...
## $ team_a            <chr> ...
## $ team_b            <chr> ...
## $ game_date         <dttm> ...
## $ stage             <chr> ...
This table has its 13474 entries made by 286 players.
“Home team” vs “Away Team”
Is there a bias of position (“Home team” vs “Away Team”)? Needless to say, during the Euro 2016, all teams were actually ‘Away’ teams, except for the hosting country’s team, France. I’ll just stick to the naming convention, because of it would be awkward to talk about the “first/second team” or the “left/right team”.
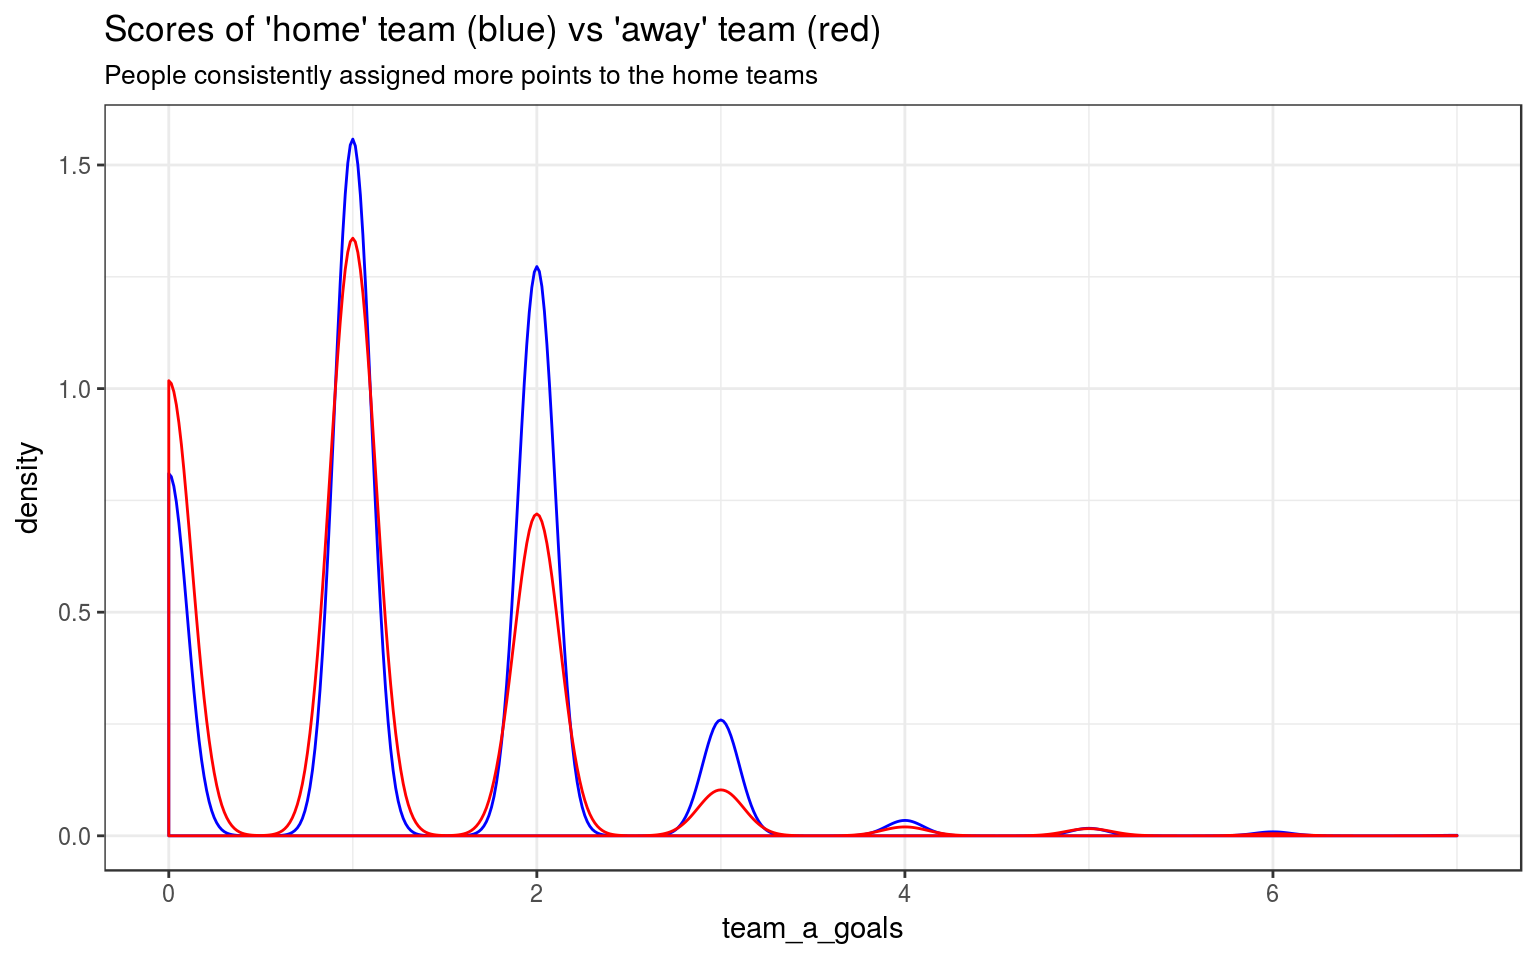
Indeed, the ‘home’ team seems to be preferred by the participants. They think the home teams will, on average, score more goals than the ‘away’ team.
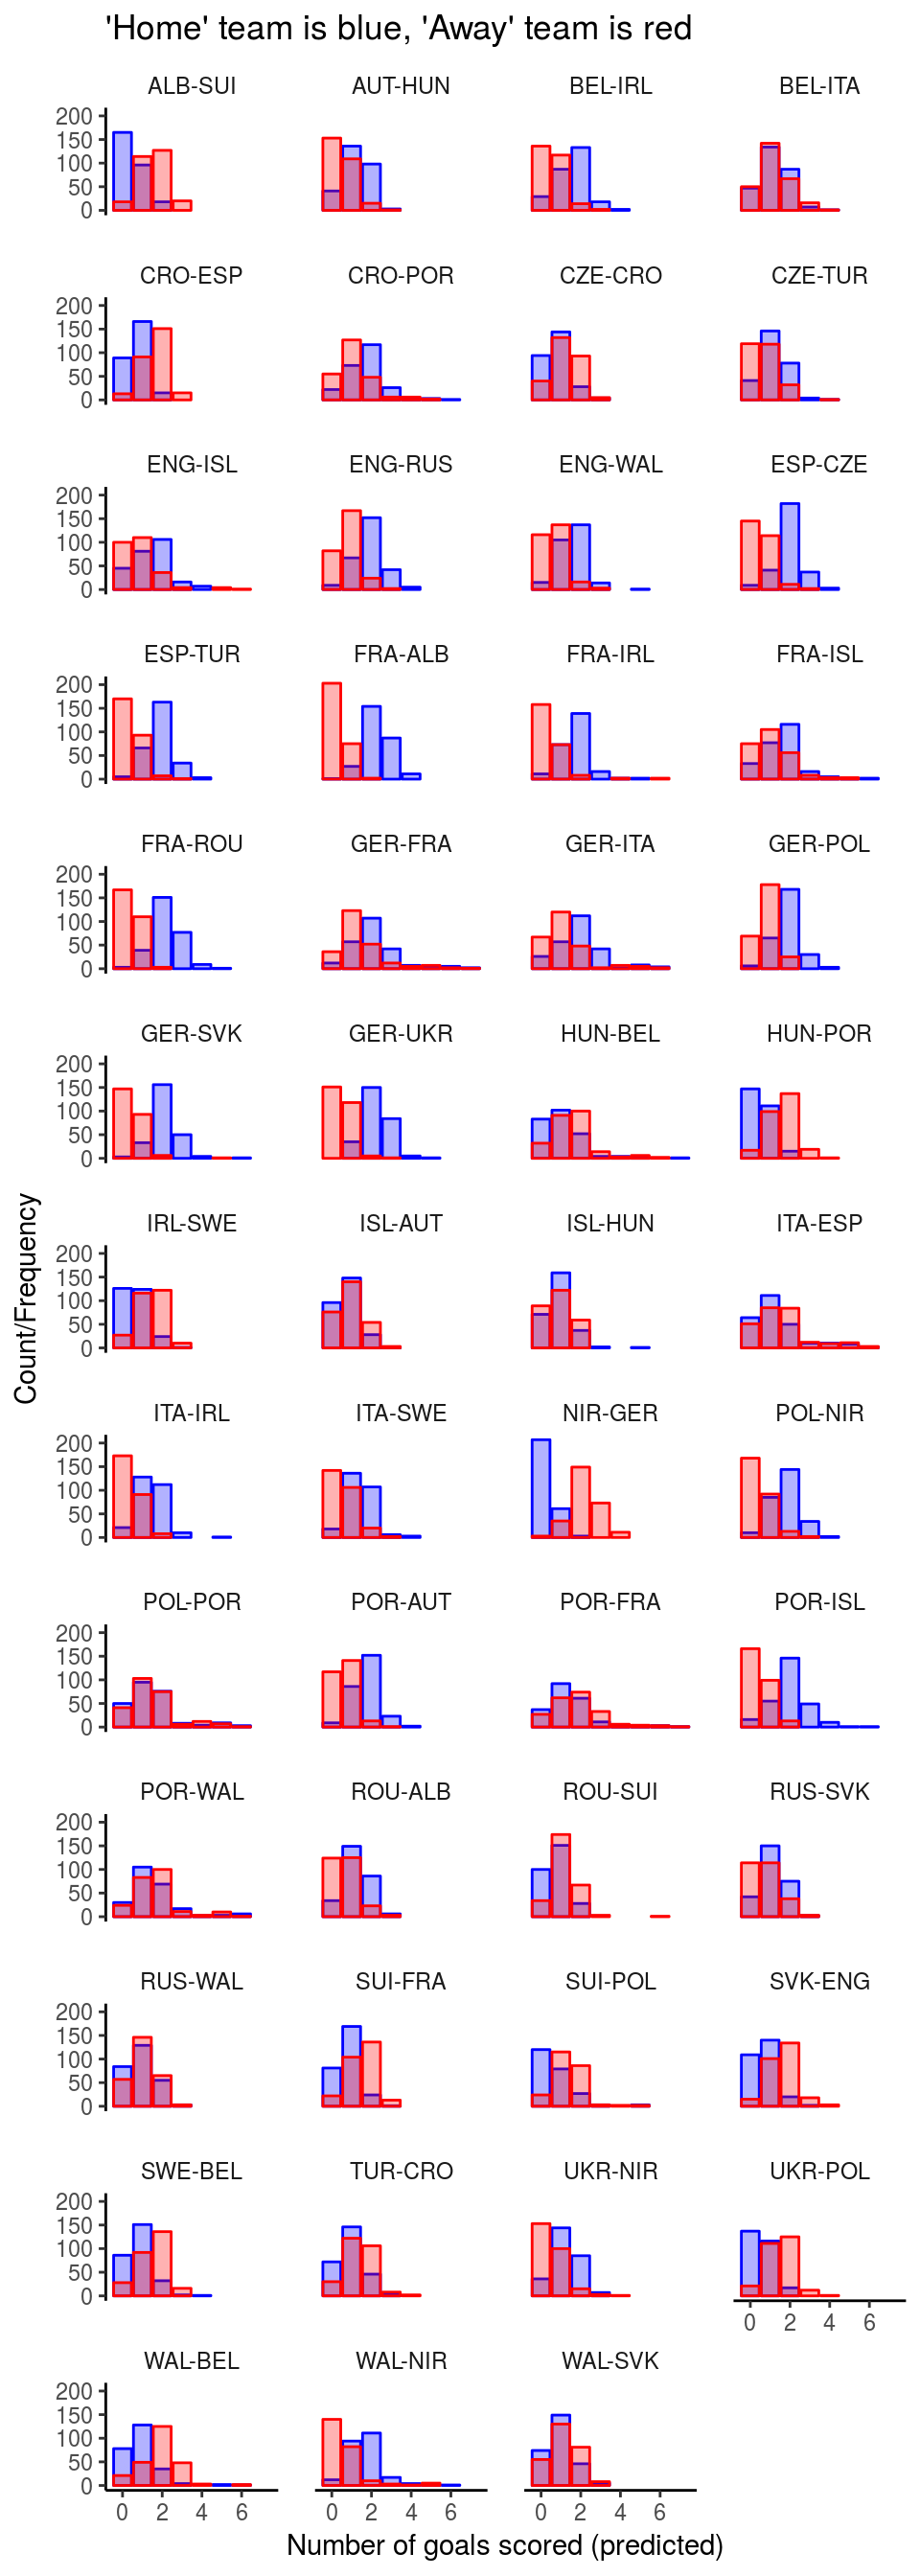
Visualisation of aggregated scores
The following set of histograms demonstrates the same as before. The “away” teams (shown in red) have their maximum more often on the left side (near zero goals) than on the right side (more goals).
A better visualisation
In this array of xy-plots, circles show predicted number of goals, for the respective opponents of each game. The size of circles is proportional to the number of people who claimed that this many goals would occur.
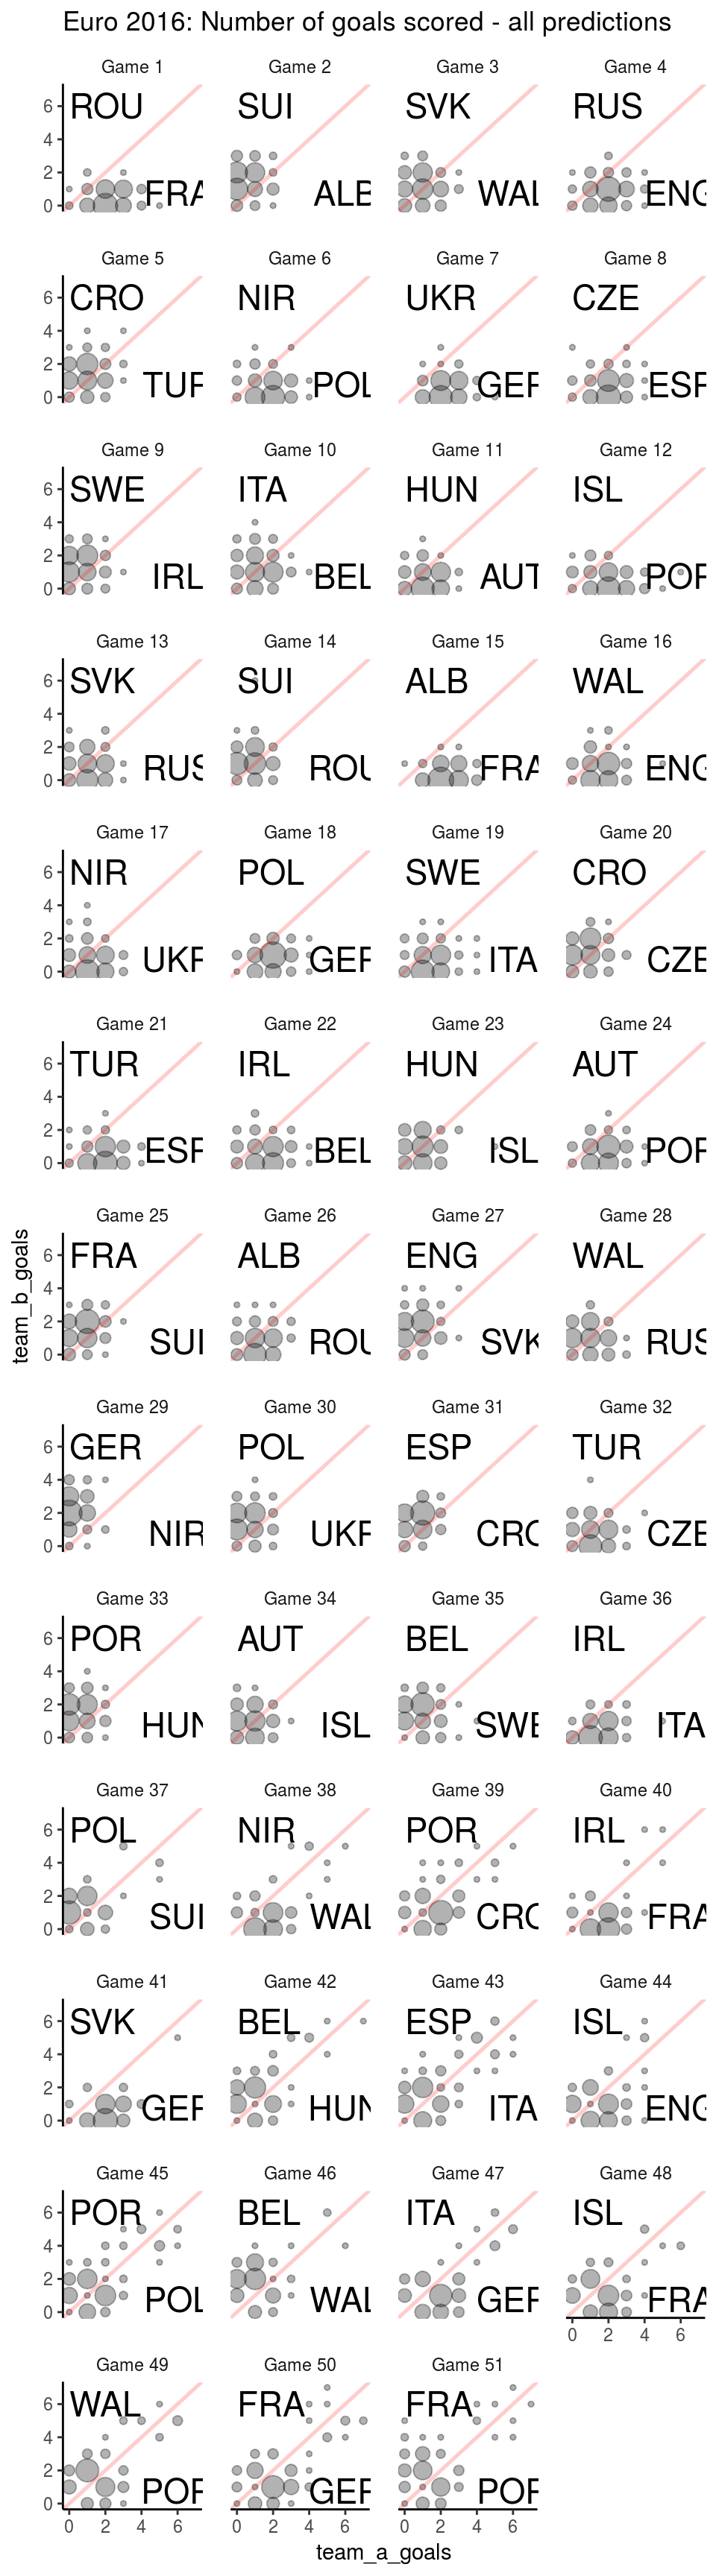
These plots above show more clearly the range of goals scored, in particular for the knockout round. It is common that penalty shootouts occur at the end of KO-round games. People have been expecting that.
‘Joker’ Games
Which games were preferred for ‘Jokers’?
Participants can pick a few ‘Joker games’, doubling the betting scores. Players correctly scoring with Jokers can earn huge amounts of reward points, making the leaderboard much more dynamic over the course of the tournament.
jokers_top %>%
        arrange(n, game_name) %>%
ggplot( aes(reorder(game_name, -n),n)) +
        geom_bar(stat="identity", color="grey", fill="skyblue") +
        geom_text(aes(label =  n), vjust = "inward", size=2.5) +
        theme(axis.text.y = element_text(size=10)) +
        theme(axis.text.x = element_text(size=8)) +
        xlab("Euro 2016 Game") +
        ylab("Count/Frequency (Picked as Joker n times)") +
        coord_flip() +
        ggtitle("Most popular soccer matches for 'Joker' bets",
                subtitle = "Most popular choices are at the bottom of the figure")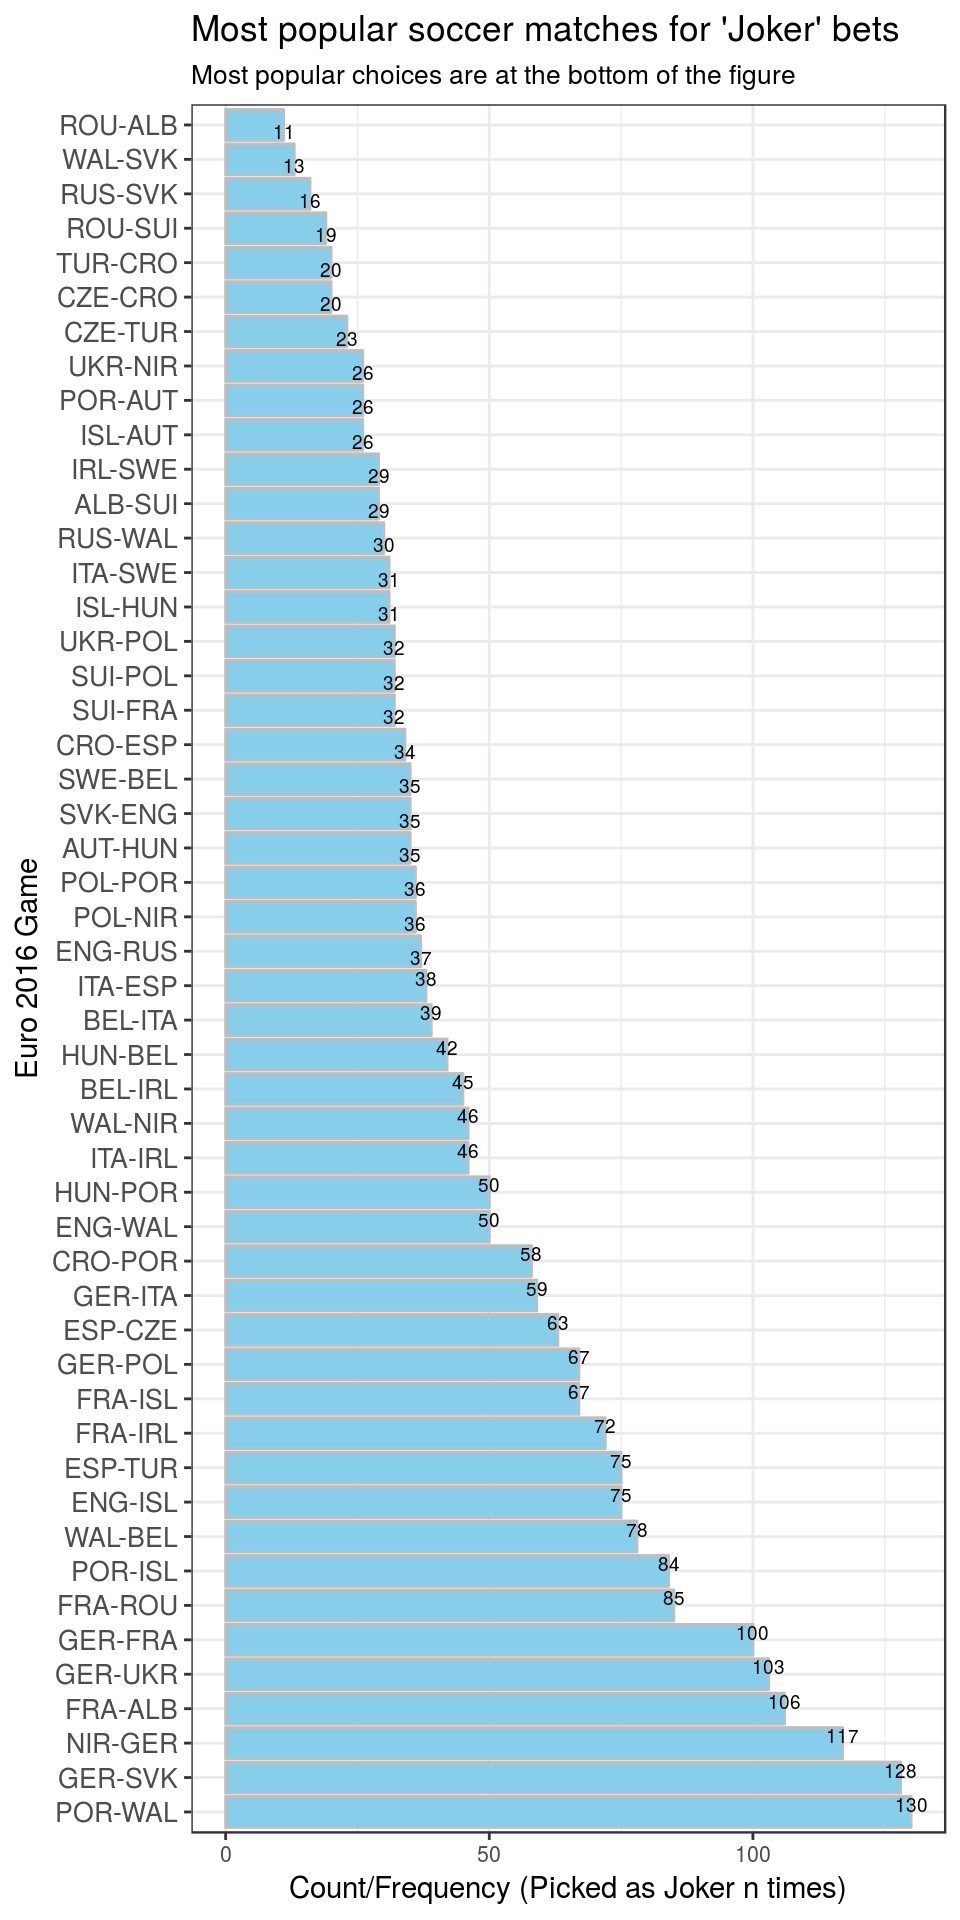
Of course, Germany’s games (from group stage as well as K.O. stage) were preferred by the players. Additionally players apparently prefer assign Jokers on teams participating in the quarter- and semi-finals. However, alternatives to place joker bets for KO-round games are limited, simply because there are fewer games. All participants have to pick some of these. Therefore, I guess, Portugal’s games stand out - people saw it as the clear favourite for the semifinal game POR-WAL (Portugal-Wales).
However, games from early in the tournament (FRA-ROU, FRA-ALB) were also picked relatively often.
Surprisingly, games of the former Euro 2012 champion, Spain, were not particularly popular as ‘Joker’ games. Maybe the community didn’t expect them to win clearly. Spain had tough competitors (CZE, TUR, CRO).
A short note on draws
There were 36 matches in the group phase of the Euro 2016. Of these 11 (31%) ended in a draw. (There were 51 matches in total).
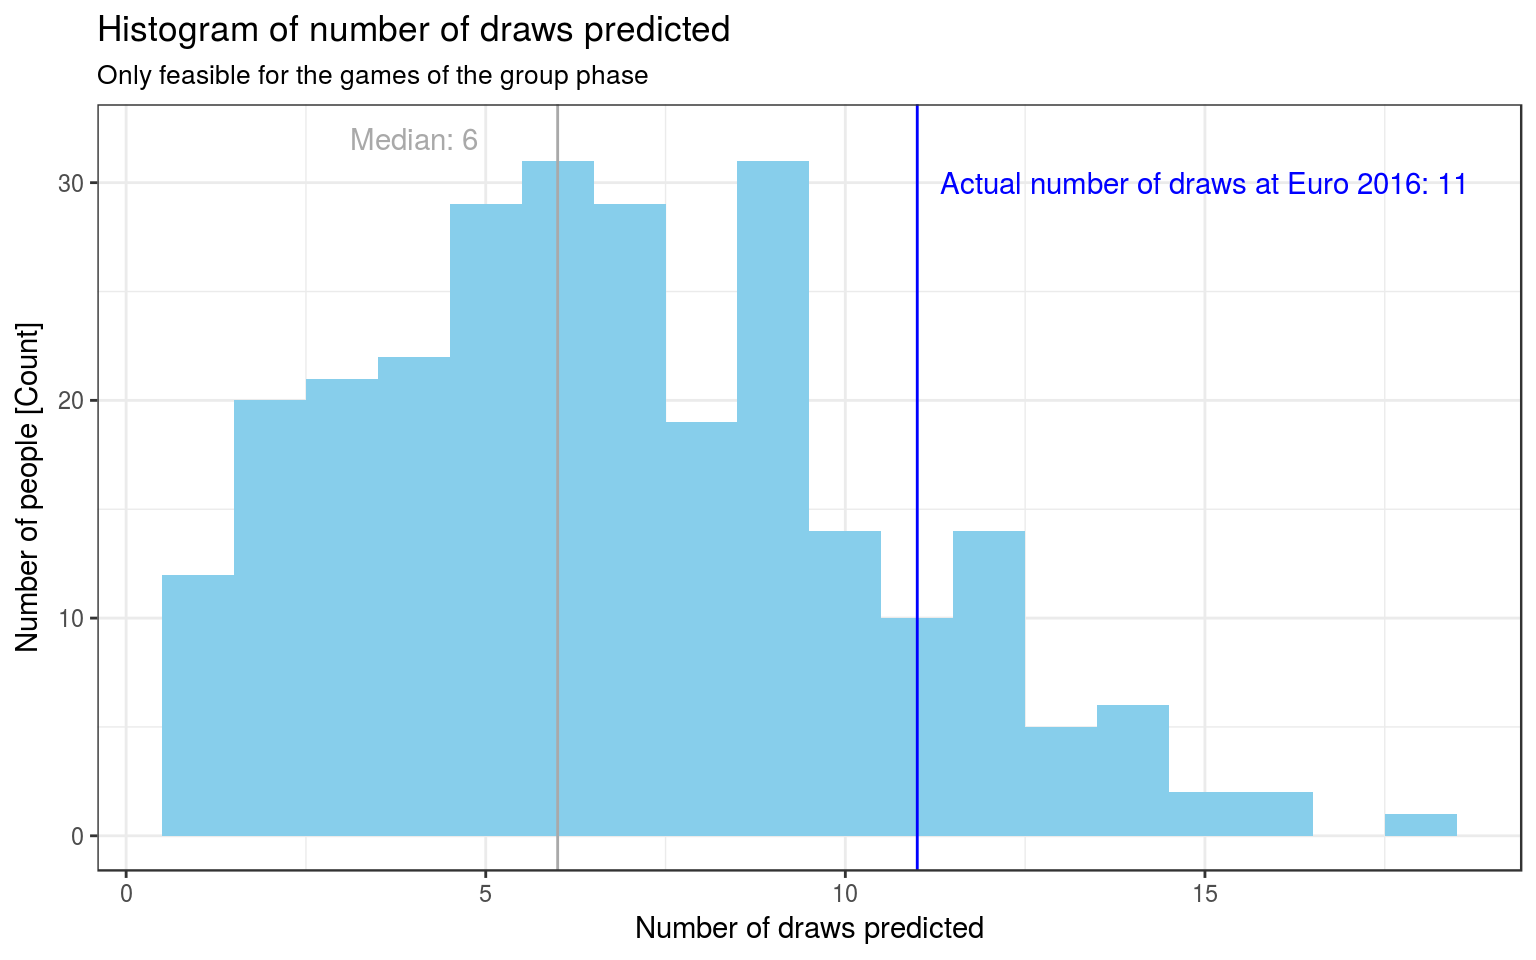
The median value for “number of matches predicted as draw” is n=6. Few people (n=40) have predicted at least 11 draws, though.
Winning Players of the betting game
Is ‘predicting a lot of draws’ a winning strategy?
Yes. Of the 36 prize money winners, n=30 (83%) have predicted more than the median number of draws (6).
| Last Name | First Name | # Draws predicted | Money Rank | |
|---|---|---|---|---|
| 1 | E* | M***** | 15 | 14 |
| 2 | M******** | J**** | 14 | 19 |
| 3 | N***** | D** | 14 | 2 |
| 4 | N***** | V************** | 14 | 3 |
| 5 | M***** | F****** | 13 | 30 |
| 6 | N***** | V******** | 13 | 21 |
| 7 | K*** | D***** | 12 | 8 |
| 8 | K***** | R****** | 12 | 10 |
| 9 | G****** | A****** | 11 | 19 |
| 10 | M*** | C******** | 11 | 30 |
| 11 | B******* | T***** | 10 | 17 |
| 12 | K***** | F**** | 10 | 17 |
| 13 | R**** | T****** | 10 | 15 |
| 14 | S*********** | A***** | 10 | 30 |
| 15 | U***** | K****** | 10 | 30 |
| 16 | B********* | F**** | 9 | 1 |
| 17 | F***** | A**** | 9 | 4 |
| 18 | G* | H**** | 9 | 28 |
| 19 | H**** | D*** | 9 | 30 |
| 20 | K**** | M******* | 9 | 23 |
| 21 | P*** | S******* | 9 | 11 |
| 22 | R**** | D***** | 9 | 30 |
| 23 | S****** | L**** | 9 | 7 |
| 24 | W******** | I*** | 9 | 22 |
| 25 | E********* | G*** | 8 | 23 |
| 26 | B********* | E*** | 7 | 23 |
| 27 | K******* | F**** | 7 | 23 |
| 28 | L******* | D**** | 7 | 5 |
| 29 | M**** | K****** | 7 | 11 |
| 30 | S********** | B******* | 7 | 5 |
Detailed analysis of game scores
Which games where predicted successfully?
There were 1618 games predicted correctly by these many unique players. Success rate: 1618/13474 = 12%
Which game scores did nobody predict correctly?
| Game # | Team A | Team B | Score | Draw | Correct by # | |
|---|---|---|---|---|---|---|
| 1 | 48 | FRA | ISL | (5:2) | 0 | |
| 2 | 42 | HUN | BEL | (0:4) | 0 | |
| 3 | 33 | HUN | POR | (3:3) | draw | 0 |
| 4 | 28 | RUS | WAL | (0:3) | 0 |
These were the only 4 games where nobody has guessed the scores correctly.
What about getting the ‘tendency’ right?
This table shows the most accurately predicted ‘tendencies’. The two rightmost columns indicate the number of people who got it right.
| Game # | Team A | Team B | Score | Draw | Tendency | Correct |
|---|---|---|---|---|---|---|
| 15 | FRA | ALB | (2:0) | 275 | 118 | |
| 1 | FRA | ROU | (2:1) | 265 | 49 | |
| 7 | GER | UKR | (2:0) | 264 | 88 | |
| 29 | NIR | GER | (0:1) | 262 | 29 | |
| 21 | ESP | TUR | (3:0) | 249 | 18 |
This table shows the least accurately predicted ‘tendencies’(is win / is draw). The two rightmost columns indicate the number of people who got it right.
| Game # | Team A | Team B | Score | Draw | Tendency | Correct |
|---|---|---|---|---|---|---|
| 17 | UKR | NIR | (0:2) | 33 | 2 | |
| 11 | AUT | HUN | (0:2) | 30 | 3 | |
| 12 | POR | ISL | (1:1) | draw | 23 | 17 |
| 31 | CRO | ESP | (2:1) | 10 | 7 | |
| 36 | ITA | IRL | (0:1) | 6 | 2 |
Plot all of them together
The plot below shows: Matches on the left were ‘easiest’ to guess. Games in the lower right corner of plot were ‘less predictable’, according to the wisdom of the participants.
Surprisingly, Germany-Poland (0:0) is also in the region of ‘less predictable’. Almost nobody expected this result.
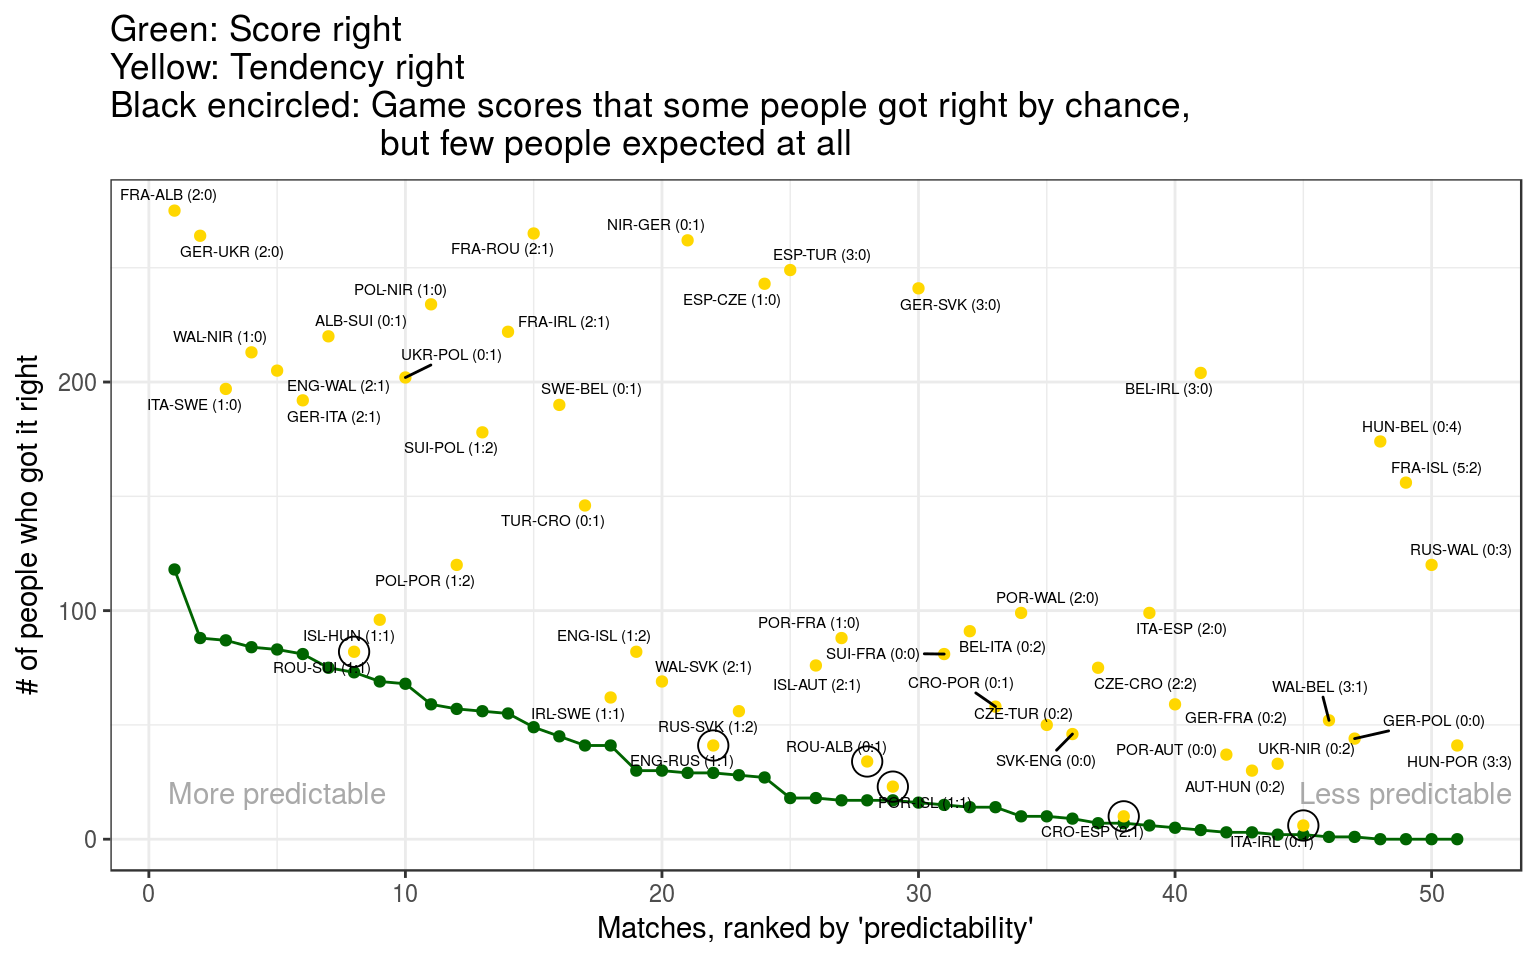
A second look at surprising games
In the plot above, a few games (close to the green line) are marked with a black circle. This table shows these marked games. They were similar to the 4 games in the table that nobody got right: very few participants also got the tendency right.
| Game # | Team A | Team B | Score | Draw | Tendency | Correct | Pos on X-Axis |
|---|---|---|---|---|---|---|---|
| 14 | ROU | SUI | (1:1) | draw | 82 | 73 | 8 |
| 4 | ENG | RUS | (1:1) | draw | 41 | 29 | 22 |
| 26 | ROU | ALB | (0:1) | 34 | 17 | 28 | |
| 12 | POR | ISL | (1:1) | draw | 23 | 17 | 29 |
| 31 | CRO | ESP | (2:1) | 10 | 7 | 38 | |
| 36 | ITA | IRL | (0:1) | 6 | 2 | 45 |
Half of these games were draws.
Conclusion
In the next run of the betting game (FIFA World Cup 2018), I’ll predict more draws, and also put my jokers on draws. When I predict non-draw games, I will carefully adjust my predicted scores such that they will be slightly in favor of the “B” team, on the right side of the scoresheet. This alone will distance myself from the majority of the players. Otherwise, I won’t make it into the ranks that win some of that prize money.